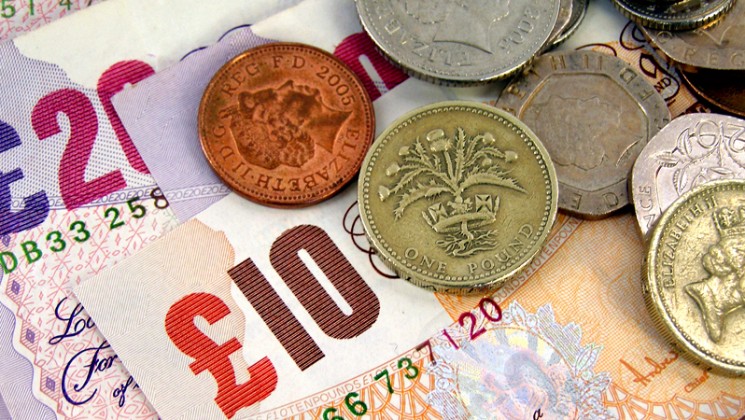
Money is getting tight. That’s a reality nearly everyone experiences – our wages just don’t seem buy the things they used to, especially after 10 years of austerity.
But what do the actual figures say?
UNISON’s bargaining support group regularly publishes information on key economic indicators and other data to support our activists in branches who negotiate with local employers.
The latest is an exhaustive document covering bargaining on annual pay rises – and it contains a lot of information on average wages, pay rises and inflation over recent years and what’s likely to happen to them over the next few years, according to forecasts.
There are two main ways of measuring inflation – the retail price index (RPI) and the consumer price index (CPI).
The government prefers CPI, which showed inflation running at 2.4% in October. That’s the measure that is shown most often in media reports. Meanwhile, RPI inflation was 3.3%.
The CPI index excludes housing and some other costs to provide a common measure across different economies. It is usually lower than RPI, but UNISON argues that RPI is the one that gives a truer measure of inflation for ordinary working people.
After all, we all have to pay for a roof over our heads.
Using RPI, inflation was around 5% throughout 2010 and ’11, dropped to around 3% for most of 2012 to ’14, and sank to 1% in 2015. Since 2016, it has been climbing again, hitting 4% last year before dropping to the latest 3.3% figure.
In all, the cost of living has risen by 27.6% since austerity became official government policy in 2010.
But what about the money in our pockets?
According to the latest figures, average weekly earnings are 2.8% higher than they were a year ago – and that’s true for the economy as a whole, for the private sector and for the public sector.
And the most recent pay rises are averaging 2.8% for the whole economy, 2.8% for the private sector, 2% for the public sector and 2.5% for the community and voluntary sector.
At the same time, as we saw above, prices are on average 3.3% more than they were a year ago.
But that’s an index of different prices – some things have risen much faster. Petrol and oil have gone up 10.8%, average electricity bills are 9.3% higher and gas bills 5.5%. Bus and coach fares have risen by an average 5.4%, council tax and rates by 4.9%, rail fares by 4.4% and mortgage interest payments by 4.1%
But it’s nearly 2019 now: what do forecasters say will happen to the economy, to prices and to our wages (in general) next year?
The forecast is that 2019 will see prices rise by 3.1% (measured by RPI) and average earnings increase by 3% while the economy as a whole, measured by ‘gross domestic product’ or GDP, will grow by 1.5%.
And beyond that, the Treasury forecasts that prices will rise by another 3% in 2020, 3.1% in 2021 and 3.2% in 2022 – giving a total cumulative increase of 13% over the next four years.
Of course, these are just forecasts. The reality of price increases between now and 2022 could be lower … or higher yet.
And wages? Well, the Office for Budgetary Responsibility is working to predictions of a 2.4% increase next year, followed by a 2.5% rise in the average earnings index in 2020, 2.8% in 2021 and 3.0% in 2022 – still well behind than the Treasury forecasts for inflation.
But what the Office for Budgetary Responsibility thinks will happen to wages across the economy over the coming year is not a limit on what UNISON or our members will expect. Wages are something we negotiate.
And of course, when we negotiate our strength lies in numbers: the more of us there are, the louder and stronger our voice.
Which is just another reason our focus on recruitment and growth is important – let’s grow stronger together.
Download the full October Bargaining on Annual Pay Rises guide (36pp Word document)


